“Our favorite holding period is forever.” – Warren Buffet. “The reality is, it’s time in the market, not timing the market,” – Chairman Keith Banks. “If you aren’t willing to own a stock for 10 years, don’t even think about owning it for 10 minutes.” – Warren Buffet. It seems like all the greatest investors of all time believe that the only thing needed to make money in the stock market is to put money in and wait for it to grow for decades. While it may provide good results, why not make those good results great?
Through the use of fundamental analysis, technical analysis, charting, and economic indicators, it is possible to “time” the market to some extent. For example, if the Federal Reserve released inflation data that stated that inflation is at an all-time high, it may not be time to put everything into the market, as it is common for the stock market to plunge for weeks or even months at a time after an announcement such as this. While, in the long term, you will make a sizable return, in the short term, you will create a sizable headache. No one likes opening their investing account and seeing red throughout. So instead, we must evaluate the individual company, the current price, the stock pattern, and the current macro-economical situation.
Fundamental Analysis
Fundamental analysis is a method of evaluating the intrinsic value of an asset by analyzing its underlying economic and financial factors. It is often used by investors to determine the fair value of a security and to make informed investment decisions.
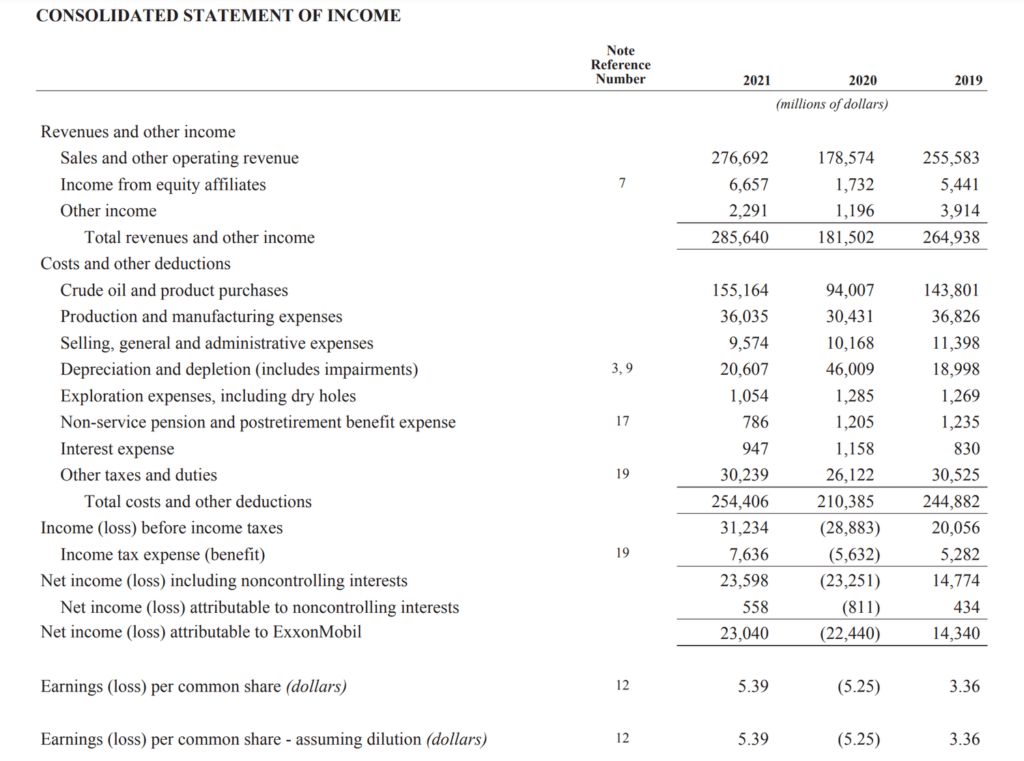
The process involves analyzing financial statements, including its balance sheet, income statement, and cash flow statement, to assess the financial health and performance of a company. As seen in Figure 1, each financial statement contains key information about progress within a business and compares it with previous years. One of the key components of fundamental analysis is the evaluation of a company’s management team and its ability to make intelligent business decisions based on the factors presented to them. Investors should also be aware of the company’s innovative policy and its ability to generate revenue and profits.
Another important aspect is the assessment of the industry in which the company operates. This includes looking at the health of the industry, as well as factors such as supply and demand, competition, and regulatory environment. Investors should have a general view of the industry and of the company’s position within the industry.
Once this information is analyzed, the fundamental analyst should make an estimate of the intrinsic value of the security. This value is then compared to the market price to determine whether the security is undervalued or overvalued.
While fundamental analysis can be a valuable tool for investors, it is important to note that it is not a perfect science. It is based on many assumptions and estimates and can be subject to personal biases and errors. As such, it is important for investors to use fundamental analysis in conjunction with other forms of analysis, such as technical analysis and to analyze the economic situation within the larger economy, to make informed investment decisions.
In conclusion, fundamental analysis is a valuable tool for investors who are looking to make long-term investment decisions. By analyzing a company’s financial statements, management team, and industry, investors can determine a security’s intrinsic value.
Technical Analysis
Technical analysis is a method of evaluating securities by analyzing statistics generated by market activity such as past prices and volume. Unlike fundamental analysis, which focuses on a company’s underlying business and financials, technical analysis focuses on price and volume data.
Technical analysts use various tools and techniques to study price and volume data, such as charts and trend lines, to identify patterns and predict future market movements. They believe that past market data can provide insight into future market behavior and that prices move in trends that can be identified and exploited.
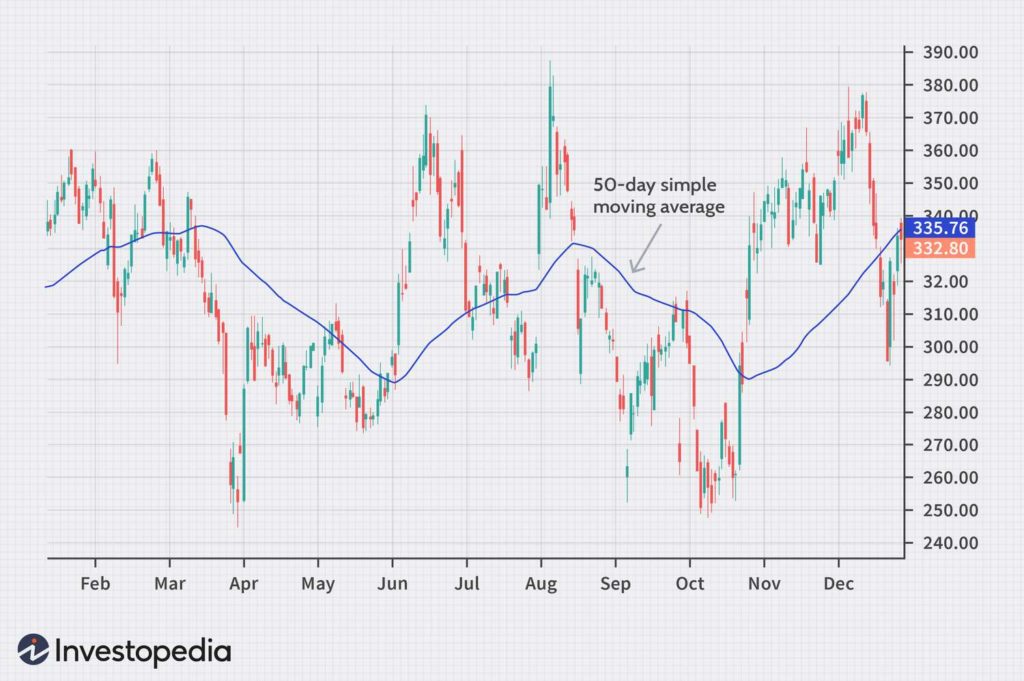
A popular tool in technical analysis is moving averages, the most popular of which is the 50-day moving average, which smooths out price data to help identify trends and potential entry and exit points for trades. As seen in Figure 2, the moving average is constantly changing to reflect market sentiment and can be a useful tool to decide when a security is overvalued or undervalued. Technical analysts may also use indicators, such as relative strength index (RSI) or stochastic oscillators, to help confirm trends and potential trading signals.
One advantage of technical analysis is that it can be applied to any security, regardless of its underlying fundamentals. This allows technical analysts to make predictions about a wide range of securities, including stocks, bonds, commodities, and currencies. But, it is most often used when evaluating a stock due to the low volatility and volume of the other securities.
However, technical analysis has its disadvantages. Some argue that technical analysis is based upon the assumption that past market data can predict future movements, which may not always be the case. In addition, technical analysis can be subject to interpretation, which means that different analysts may come to different conclusions about the same data.
Despite these criticisms, technical analysis remains a popular method of evaluating securities and making investment decisions. Many traders and investors use technical analysis in conjunction with fundamental analysis to help make more informed investment decisions for the short term.
Charting
Charting is a method of visualizing data, such as prices and volumes. Charts are used in close conjunction with technical analysis to identify patterns and trends that can be exploited for day trading or even swing trading. The use of charts, like technical analysis, is subject to interpretation.
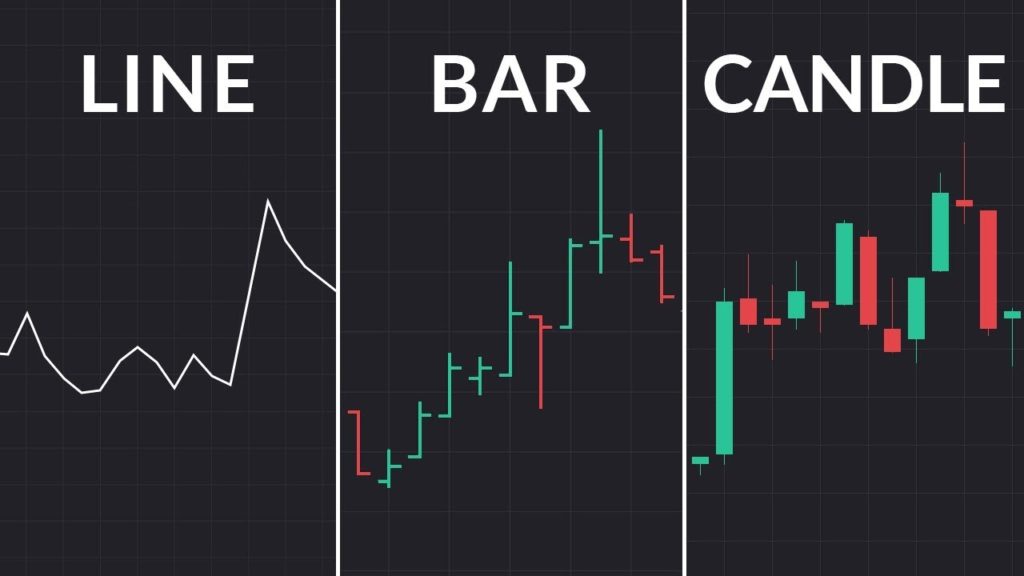
There are various types of charts, shown in Figure 4, that are used, including line charts, bar charts, and candlestick charts. Line charts are the simplest type of chart, showing only the closing price for a security over a given time period. Bar charts provide more information, showing the open, high, low, and close for over an interval. Candlestick charts are like bar charts, but they use red and green to show whether the security closed higher or lower than the opening price. Candle charts are the most widely used due to their simplicity and utility. In addition to the type of chart, technical analysts may also use various tools and techniques to study the data. For example, they may use trend lines, moving averages, and indicators to help identify patterns and potential trading signals.
These patterns, such as head and shoulders or double tops and bottoms, are created by the interaction of buyers and sellers in the market. This can indicate potential changes in the direction of the price or a breakout from a resistance line.
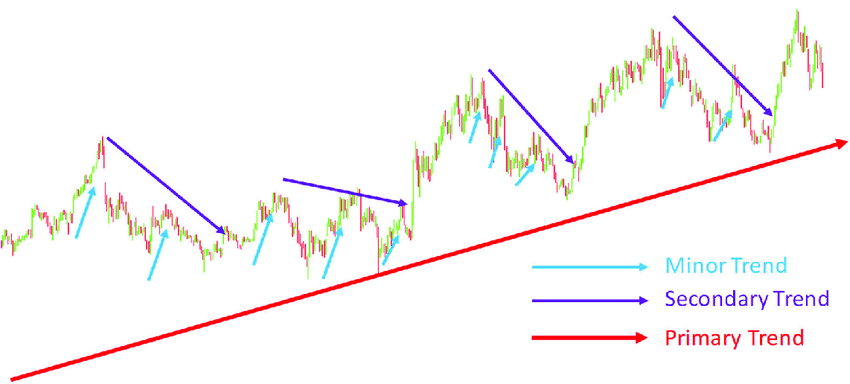
When charting, investors must assume that the stock market and individual stocks move in ever-changing trends. Primary trends refer to long-term directional movements. These trends can last for months or even years and are characterized by sustained upward or downward movements in security prices. The market has had a positive primary trend since its start as it has grown considerably since its creation despite events like the great depression, the great recession, and many other market downturns. These recessions and depressions are secondary trends and can last for months or years. These trends, while significant, are temporary and move opposite the primary trend. The current stock market, as of December 2022, has a negative secondary trend in the scope of the history of the market due to the high inflation rate and various global conflicts. These trends present an opportunity for investors to get in or out at a more favorable price. Finally, there are minor trends that are temporary, these often last for less than two weeks and are usually corrected, or reversed, shortly after. Figure 5 presents a visualization of what these trends may look like in relation to each other
Yet, charting is not without its criticisms. Some argue that charting, like technical analysis, is based upon the assumption that past price and volume data can predict future movements. Additionally, charting is subjective and can lead to misinterpretations due to either too narrow of a view or too wide of a view.
Despite these criticisms, charting remains a popular method of evaluating securities and making short-term investment decisions. Many traders and investors use charting in conjunction with other techniques, such as fundamental analysis, to help make more informed decisions.
Charting is a valuable tool for technical analysts to visualize and study price and volume data to identify trends and potential trading opportunities. By using charting, analysts can gain insight into the behavior of securities and make more informed decisions.
Economic Indicators
Economic indicators are statistics that measure the current state and direction of an economy. These indicators can provide valuable information for investors, businesses, and policymakers to help them make informed decisions.
There are various types of economic indicators, including leading, lagging, and coincident indicators. Leading indicators, such as consumer confidence and stock prices, tend to change before the economy as a whole, often causing changes in the economy. Lagging indicators, such as unemployment and inflation, tend to change as a result of the state of the economy. Coincident indicators, such as gross domestic product (GDP) and industrial production, tend to change at the same time as the economy.
There are many indicators but they all represent parts of the economy and it is important to incorporate multiple indicators before making a decision. One of the most widely used economic indicators is GDP, which measures the total value of goods and services produced in an economy. GDP is a broad measure of economic activity and can provide insight into the overall health of an economy. Other important economic indicators include inflation (CPI), which measures the rate at which prices for goods and services are rising, and employment, which measures the rate of employment among workers who are willing to work.
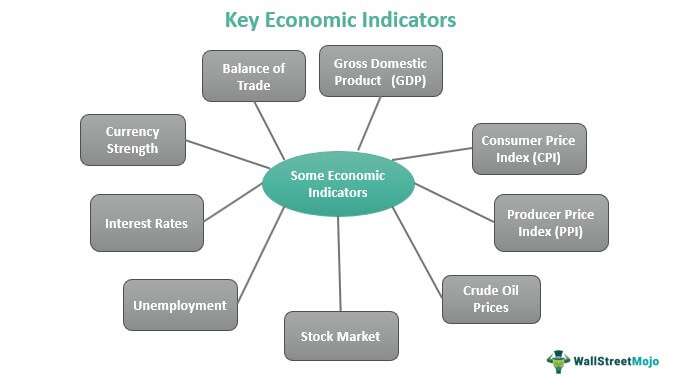
Economic indicators can also be categorized by the sector of the economy they measure. For example, housing indicators, such as housing starts, which measure the number of new constructions, and home sales provide information about the health of the housing market and the real estate sector in the stock market. Other indicators, such as the purchasing managers’ index (PMI), which indicates manager sentiment, provide specific information about various sectors.
Most economic indicators are released on a regular schedule, usually monthly or quarterly. These releases can have a significant impact on financial markets, as investors and traders adjust their positions based on the latest economic data.
Despite their importance, economic indicators are not perfect. They are based on the available data, which may not always reflect the current state of the economy. While economic indicators are more objective, different analysts may come up with different underlying causes and base their predictions differently.
Overall, economic indicators are an important tool for investors, businesses, and policymakers to understand the current state and direction of an economy. By monitoring key indicators, they can make more informed decisions and better prepare for future economic conditions.
Putting It All Together
It is important to incorporate all these techniques when analyzing securities. Here is an example of what that may look like with the stock of Amazon (AMZN) during 2020:
Amazon is an international tech company that operates in the e-commerce and cloud computing industries. As an investor, you are considering buying shares of Amazon and want to perform a thorough analysis of the company’s stock to make an informed investment decision.
To begin, you gather as much information as you can about Amazon, including its financial statements, latest press releases, and recent industry news. You use this information to perform a fundamental analysis of the company, which involves evaluating its financial health, management, and competitive position within its industry.
Based on your fundamental analysis, you conclude that Amazon has strong financials, a competent management team, and a favorable market position. You decide to dig deeper and perform a technical analysis of the company’s stock.
For this, you use charting tools and economic indicators to analyze the stock’s price movements and trading volume in response to economic events. You notice that the stock has been in a positive primary trend over the past year, with strong support at certain price levels and low volatility. You also observe that trading volume has been consistently high, indicating strong investor confidence in the stock.
In addition to the technical analysis, you also consider macroeconomic factors that could impact Amazon’s stock price. You look at indicators such as GDP growth, inflation, and consumer confidence, as these can all have an influence on the stock market and individual company performance.
Overall, your analysis suggests that Amazon’s stock has strong potential for growth and could be a good investment opportunity. However, you also recognize that the stock market is unpredictable and that there are always risks involved with investing. You decide to invest a percent of your portfolio into the company over a 3-month span by utilizing dollar cost averaging (DCA). This strategy helps to combat volatility within the market and ensure a more confident starting position.
This case study illustrates how a combination of fundamental analysis, technical analysis, charting, and economic indicators can be used to analyze a company’s stock and inform investment decisions. It is important to note that this is one example and that different approaches and techniques may be more or less relevant depending on the specific company and market conditions.
References
https://www.investopedia.com/ask/answers/difference-between-fundamental-and-technical-analysis/
http://www.federalreserve.gov/
https://jfin-swufe.springeropen.com/articles/10.1186/s40854-018-0087-z
https://www.credit-suisse.com/pwp/pb/pb_research/technical_tutorial_de.pdf
govinfo.gov/app/collection/econi/
https://www.oecd.org/sdd/prices-ppp/1947731.pdf
https://seekingalpha.com/article/4450710-how-to-read-stock-charts
Excellent writeup. Very focused and concise, yet is a capsule course in stock market. Expect more like this from you.
This write up is indeed insightful.
I am thoroughly impressed by writer’s in-depth knowledge and clear explanation of the subject matter. He has done an outstanding job of breaking down complex financial concepts into easily understandable terms, making it readable for people from different backgrounds.
It is not often that we come across articles that are both informative and engaging, but Arush has managed to strike the perfect balance.
I highly recommend this article to anyone who is interested in learning more about investments and finance.
Kudos to Arush Verma for an excellent piece of work!